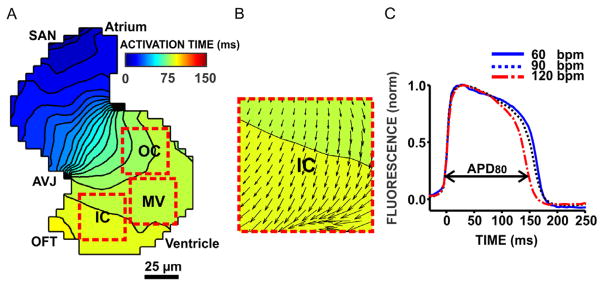
Fig. 3. Electrophysiological properties of the zebrafish embryo heart.

Action potentials propagated from the sino-atrial node (SAN) via the atrio-ventricular junction (AVJ) to the outflow tract (OFT, panel A). Isochronal maps show the positions of the depolarizing wavefront in 5 ms time intervals. Colors represent the direction of activation (from blue to red). Conduction velocity vector maps (panel B) were estimated in 35 × 35 μm2 large, non-overlapping ROIs covering the outer curvature (OC), mid-ventricular myocardium (MV) and inner curvature (IC) using an established algorithm described by Bayly et al. (1998). The action potential duration (APD80) was defined as the time from 20 % depolarization to 80 % repolarization (panel C). Increasing the stimulation frequency from 60 beats-per-minute (bpm) to 120 bpm shortened APD as expected from the mammalian heart.
