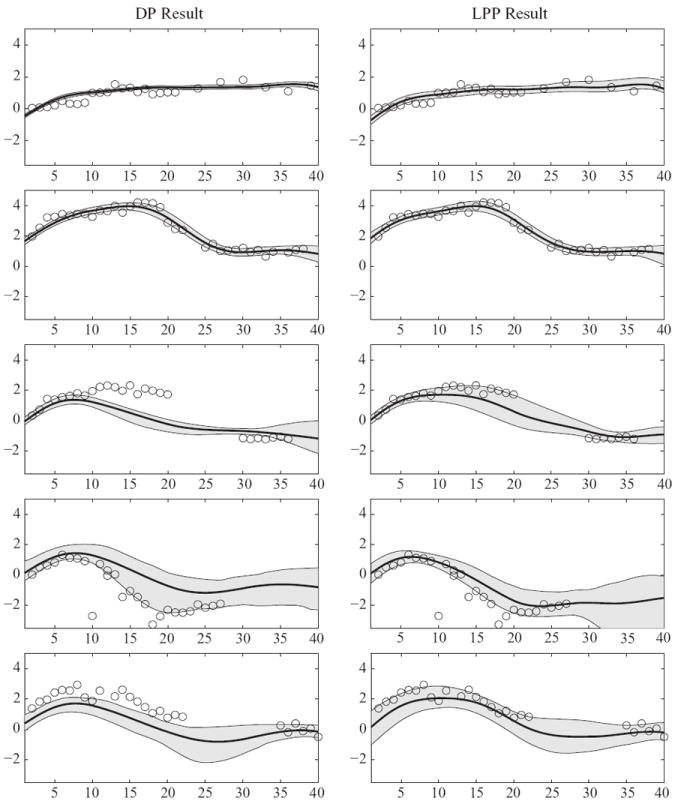
Fig. 2.

Log PdG function estimates for selected women in the Early Pregnancy Study. The posterior means are solid lines and 95% pointwise credible intervals are shown in grey. The x-axis scale is time in days starting at the estimated day of ovulation.
