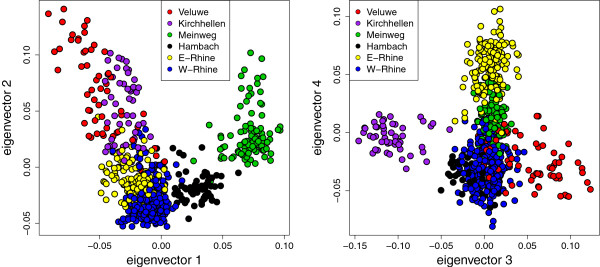
Figure 3.

PCA plots indicating the first four eigenvectors of the wild boar data only. Colours indicate the six clusters identified by structure. Putative hybrids are not indicated in this figure. Eigenvectors 1–4 explain 43% of variance in the dataset.
