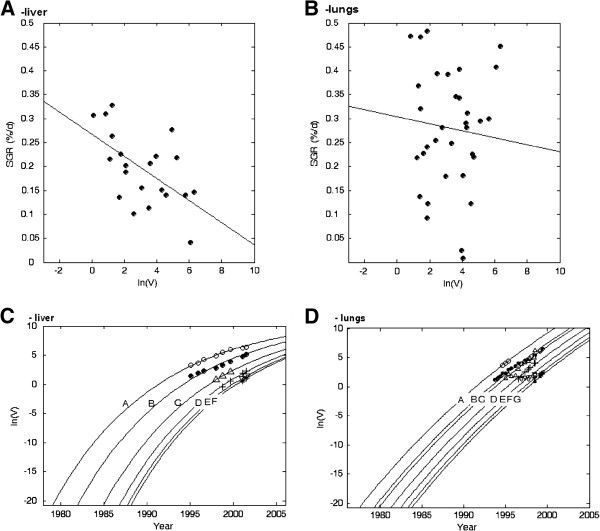
Figure 2.
SGR vs. the logarithm of the volume of the metastases in the liver (A) and the lungs (B). The best linear regression fits are shown. The correlation was statistically significant in the liver (r2 = 0.33, p < 0.005), but not in the lungs. The logarithm of the tumour volume vs. time for all metastases in the liver (C) and the lungs (D) with the general Gompertzian growth model curve fits.

