
Figure 6.
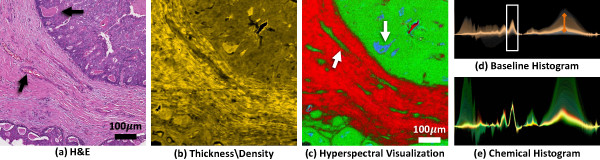
Visualization of a 1mm needle biopsy from a breast tissue biopsy at 74X magnification (scale bar = 100μm). (a) An adjacent histology slide stained with H&E is shown. Epithelial cells are purple and stromal cells are pink. Arrows indicate the position of a blood vessel and necrosis. (b) Tissue density is shown after baseline correction. (c) Features are then selected to separate stromal cells (red), epithelium (green), and necrosis (blue). The histogram shows selected spectra for estimating tissue density (d) and chemical composition (e). The composition histogram is normalized to the area under the Amide I peak (white box).