Figure 7.

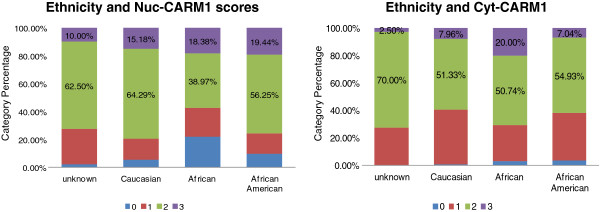
CARM1 localization is associated with ethnicity categories. Bar graphs are shown depicting the distributions of individual CARM1 scores for all tumors stratified by self-identified ethnicity.

CARM1 localization is associated with ethnicity categories. Bar graphs are shown depicting the distributions of individual CARM1 scores for all tumors stratified by self-identified ethnicity.