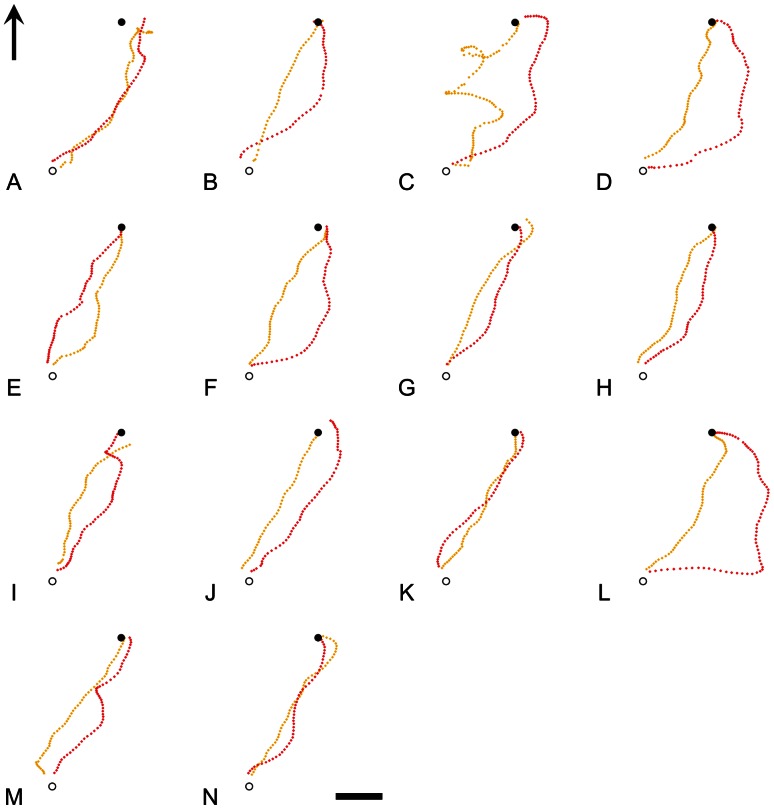
Figure 1. Individual slow clock-shifted trajectories show partial deflection in the predicted direction.
GPS-derived tracks of individual pigeons overlaid on satellite images of the area surrounding the University of Oxford Field Station, Oxfordshire, UK, including the release site (open circle) and the loft (filled circle). Panels show individual subjects’ control (yellow tracks) and first slow clock-shift release for the slow-shifted group (red tracks). The arrow in the first panel signifies North and the scale bar in the final panel represents 200 m.

