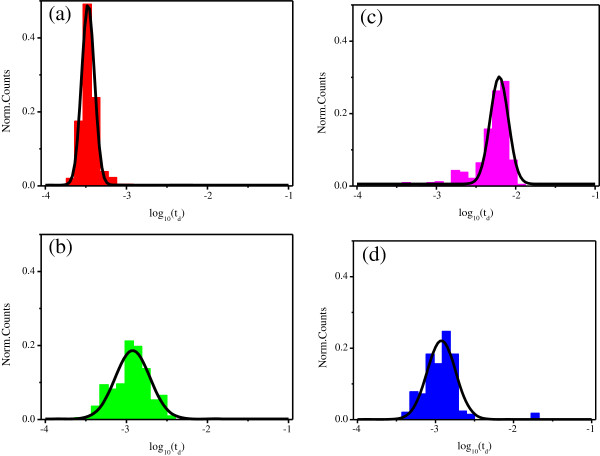
Figure 5.
The duration time histograms in a logarithmic scale. (a) In 1 M KCl solution for the 20-nm diameter nanopore, (b) in the mixed solution with 0.5 M KCl + 0.5 M MgCl2 for the 20-nm diameter nanopore, (c) in 1 M MgCl2 solution for the 20-nm diameter nanopore, and (d) in 1 M MgCl2 solution for a 7-nm diameter nanopore.

