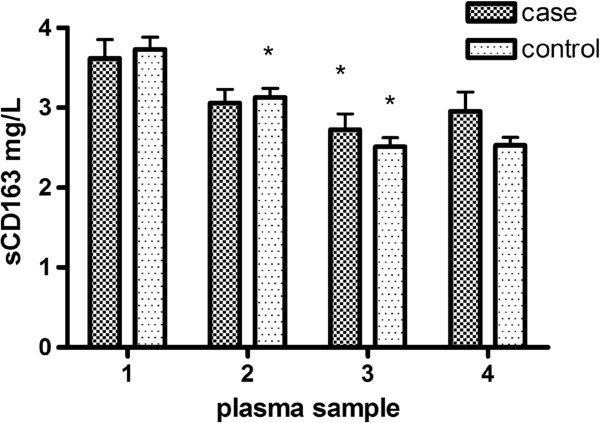
Figure 1.
Mean plasma levels of sCD163 (mg/L) at 1:last sample before initiation of ART, 2: three months after ART, 3: one year before case’s MI/index date, and 4: last sample before case’s MI/index date. Bars represent standard error of the mean (SEM). * Indicates a significant decrease in plasma level of sCD163 from the previous time point (p < 0.05).

