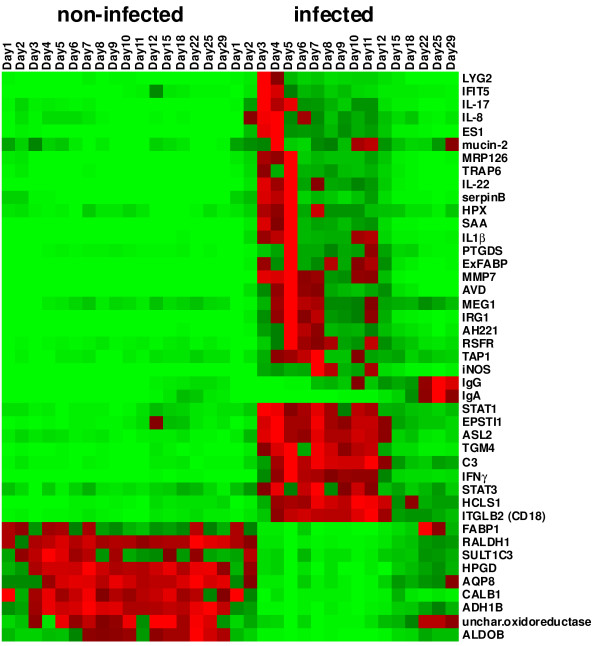
Figure 3.
Heat map of gene expression in the chicken cecum, with or without Salmonella Enteritidis infection. The heat map for each gene was calculated based on its minimal and maximal recorded expressions. The color coding (light green, the lowest expression, light red, the highest expression) thus characterizes each gene profile and the same shade of red or green color for two different genes does not necessarily correspond to the same fold increase.

