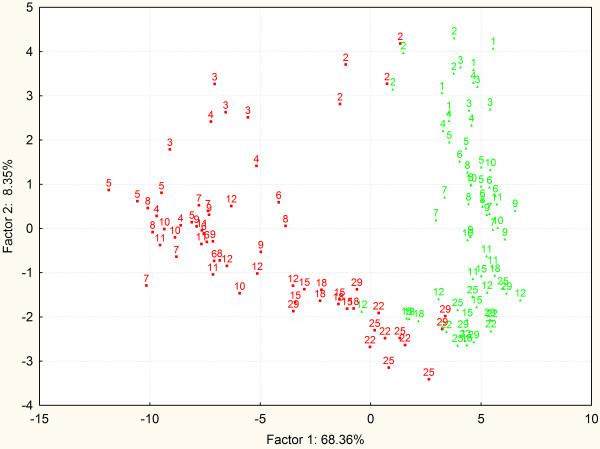
Figure 4.
PCA of the chickens clustered according to their gene expression in the cecum. Sixty-eight percent of variability explained by coordinate 1 is likely to be associated with the infection status. Coordinate 2 explaining an additional 8% of variability seems to be chicken age. Green and red color, clustering of the non-infected and infected chickens, respectively. Numbers indicate age of each particular chicken in days.

