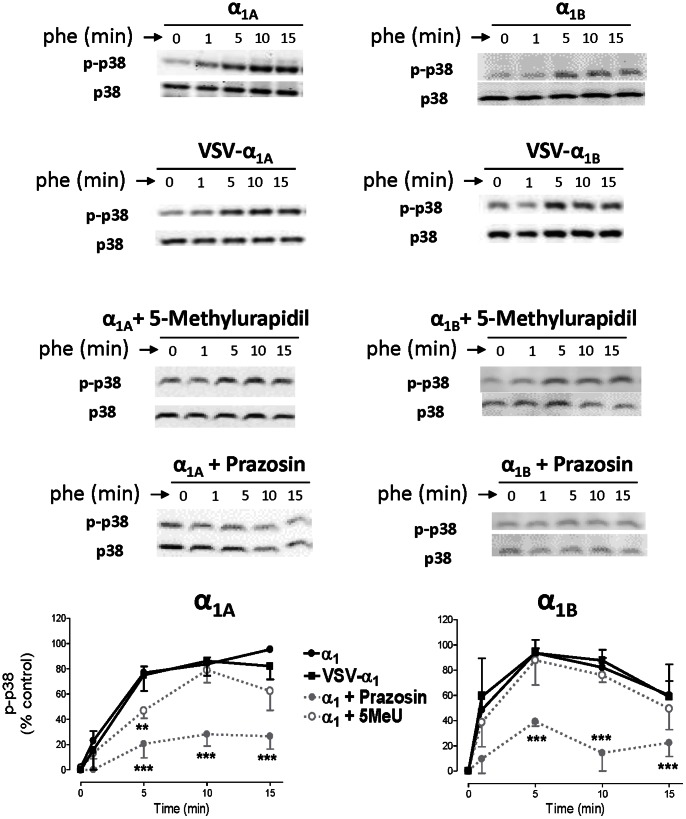
Figure 9. α1A- and α1B-AR stimulation shows a subtype-specific pattern of p38-MAPK phosphorylation.
HEK293 cells stably transfected with VSV-tagged or untagged α1A- and α1B-subtypes were serum-starved for 4 hours and stimulated with PHE (100 µM) for a 15 minute time-course at 37°C. In some experiments, prazosin (10 µM) or 5-methylurapidil (10 µM) were added for 30 min. After stimulation, cellular extracts were prepared as described under the “Experimental procedures”. Equal amounts (15 µg) of each sample were used to visualize the phosphorylated p-38 MAPK expression Western blots from representative experiments are shown. The lower panels show total p38 loaded on each sample. The graph quantifies the p-p38 MAPK signal at different times. Data represent means ± S.E.M. of 3-6 independent experiments. Student’s t test was applied to determine significant differences at a given time vs control, *p<0.05 **p<0.01 ***p<0.001.

