
Figure 1. Morphology and medullosphere count derived from adherent MB tumor cells.
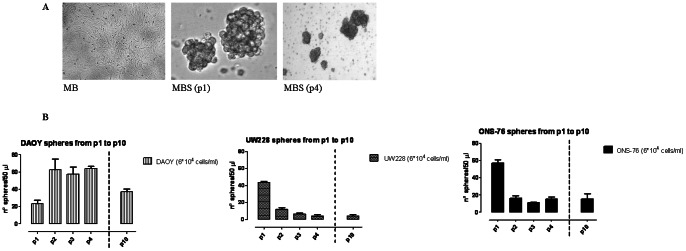
(A) Representative morphology of adherent cells and medullospheres in P1 and P4. (B) MBS count obtained with MB cell lines during different passages (P1–P10). Measurements were done in triplicate and data are presented as mean ± SD.