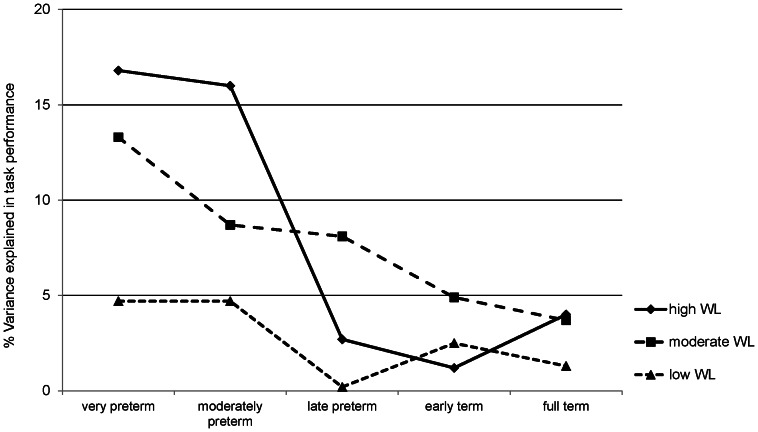
Figure 2. Variance explained by biological factors according to workload and gestational age.
Symbols represent the unique percentage of variance explained (R 2) by biological factors (GA, birth weight, OPTI score) in children's performance on low, moderate, and high cognitive workload (WL) tasks at age 8;5 years according to gestational age groups (n = 1326).

