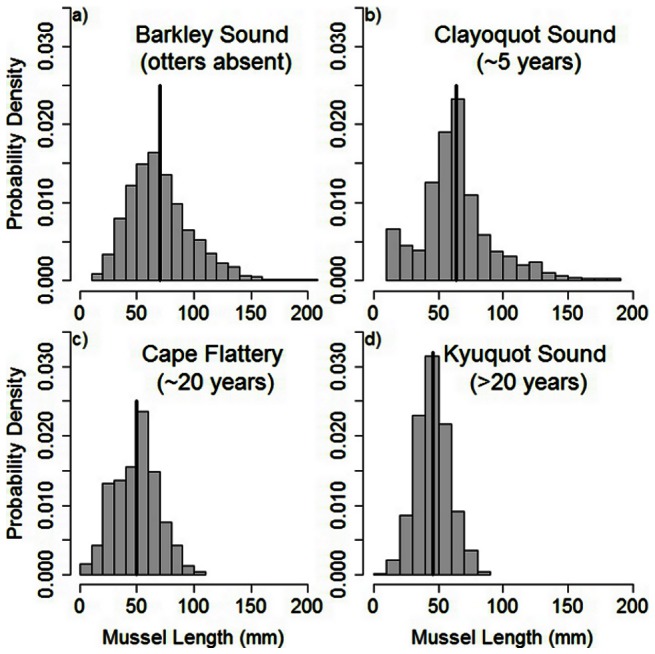
Figure 2. Size distributions of mussels in the four regions sampled.

Mean sizes of mussels are indicated for each region by the vertical bar. Sample size for the different regions are 1368 (Barkley Sound), 519 (Clayoquot Sound), 450 (Cape Flattery), and 1018 (Kyuquot Sound).
