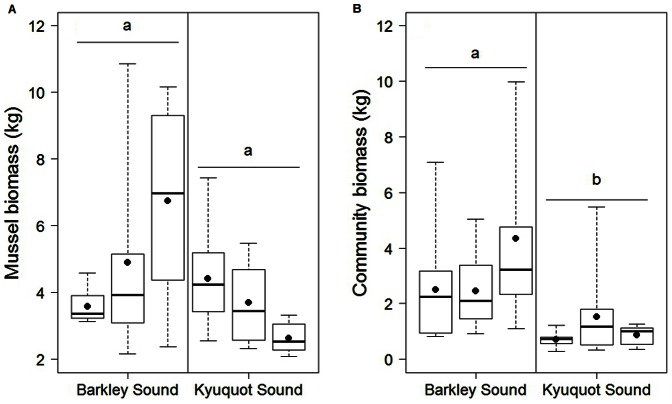
Figure 4. Biomass of mussels and mussel bed associated communities between regions with and without otters.
(A) Biomass of mussels and (B) mussel bed associated community in a 25×25 cm plot, in Barkley Sound (otters absent) and Kyuquot Sound (otters present). The three boxplots (horizontal bar: median, box: 25% and 75%, whiskers: minimum and maximum values) within each region represent the three sites sampled in each region. Dots represent site means. Different lower-case letters indicate significantly different mussel bed depths among regions.

