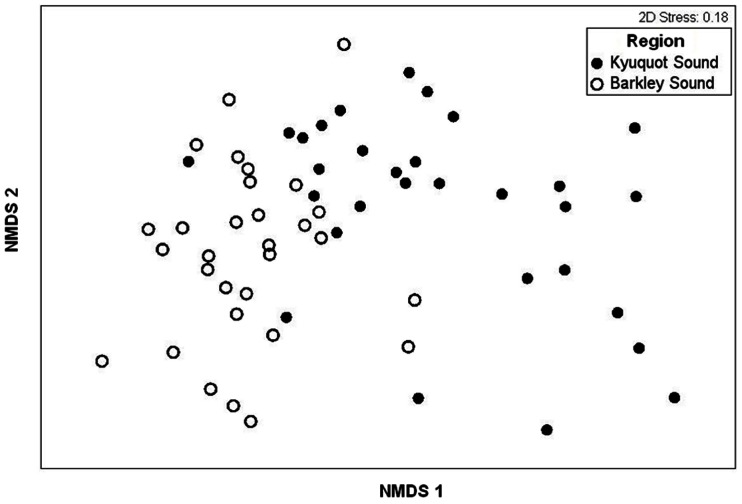
Figure 5. Community structure between regions with and without sea otters.
NMDS plot showing separation of the two regions based on invertebrate community structure. Dots represent square-root transformed biomass data from 25×25 cm mussel quadrats. The axes (NMDS 1 and 2) are dimensionless but correspond to the greatest variance among the multivariate data points.

