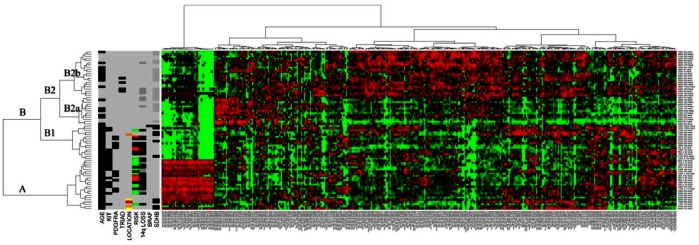
Figure 1. Full heatmap generated from complete miRNA expression data for all 73 cases.

Included at the left of heatmap are case data to include adult/pediatric categorisation, anatomic location of tumor, KIT, PDGFRA and BRAF mutational status, risk stratification for adult mutant cases, and, where available: Carney triad status, SDHB-immunoreactivity and 14q genomic status of tumor. Black = positive for feature listed. For age, black = adult, grey = pediatric; for KIT/PDGFRA/BRAF black = mutation positive while grey = WT; Black = Carney triad diagnosed; for anatomic location of tumor, grey = stomach, red = retroperitoneum, yellow = jejunum; orange = ileum; for risk, red = low, black = intermediate, green = high, grey = unavailable. For 14q loss and SDHB status, black = positive; dark grey = tested and negative, grey = not tested. The clusters are designated A, B, with sub-clusters B1 and B2, B2a and B2b to facilitate discussion of findings.
