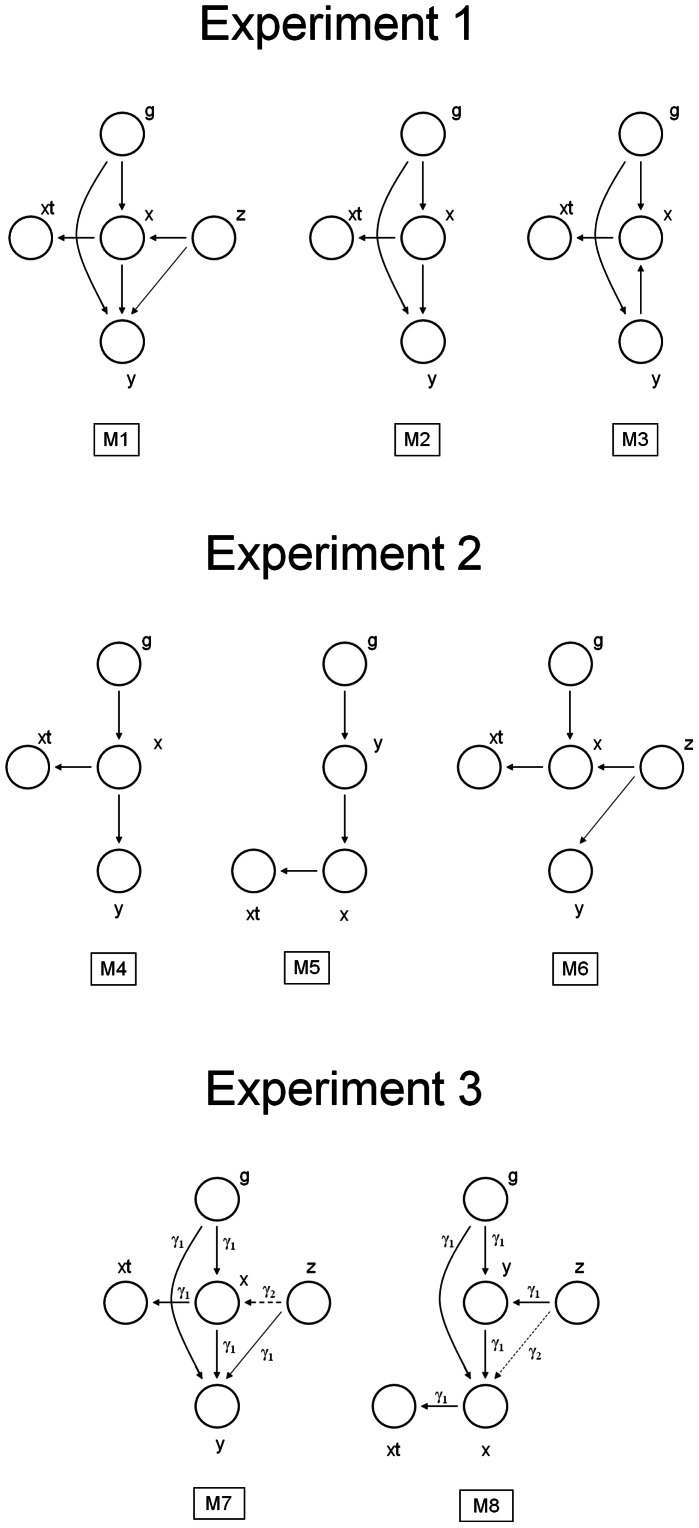
Figure 2. Graphical representation of models compared in Experiments 1 to 3 are shown.
A. Experiment 1. M1 - full causal model with confounders, M2 - causal model without confounders, and M3 - reverse model without confounders. B. Experiment 2. We compare conventional causal (M4) and conventional reverse causal (M5) models (both (i) assume absence of pleiotropic effects of instruments on biomarkers and outcomes, (ii) explicitly exclude unmeasured confounders from modelling and (iii) account for the noise in the measurement) with the model where the association between the biomarker and outcome is modelled entirely by unmeasured confounders (M6). C. Experiment 3. We compare full causal (M7) and full reverse causal model (M8), allowing for pleiotropic relationships and accounting for hidden, unmeasured confounders.

