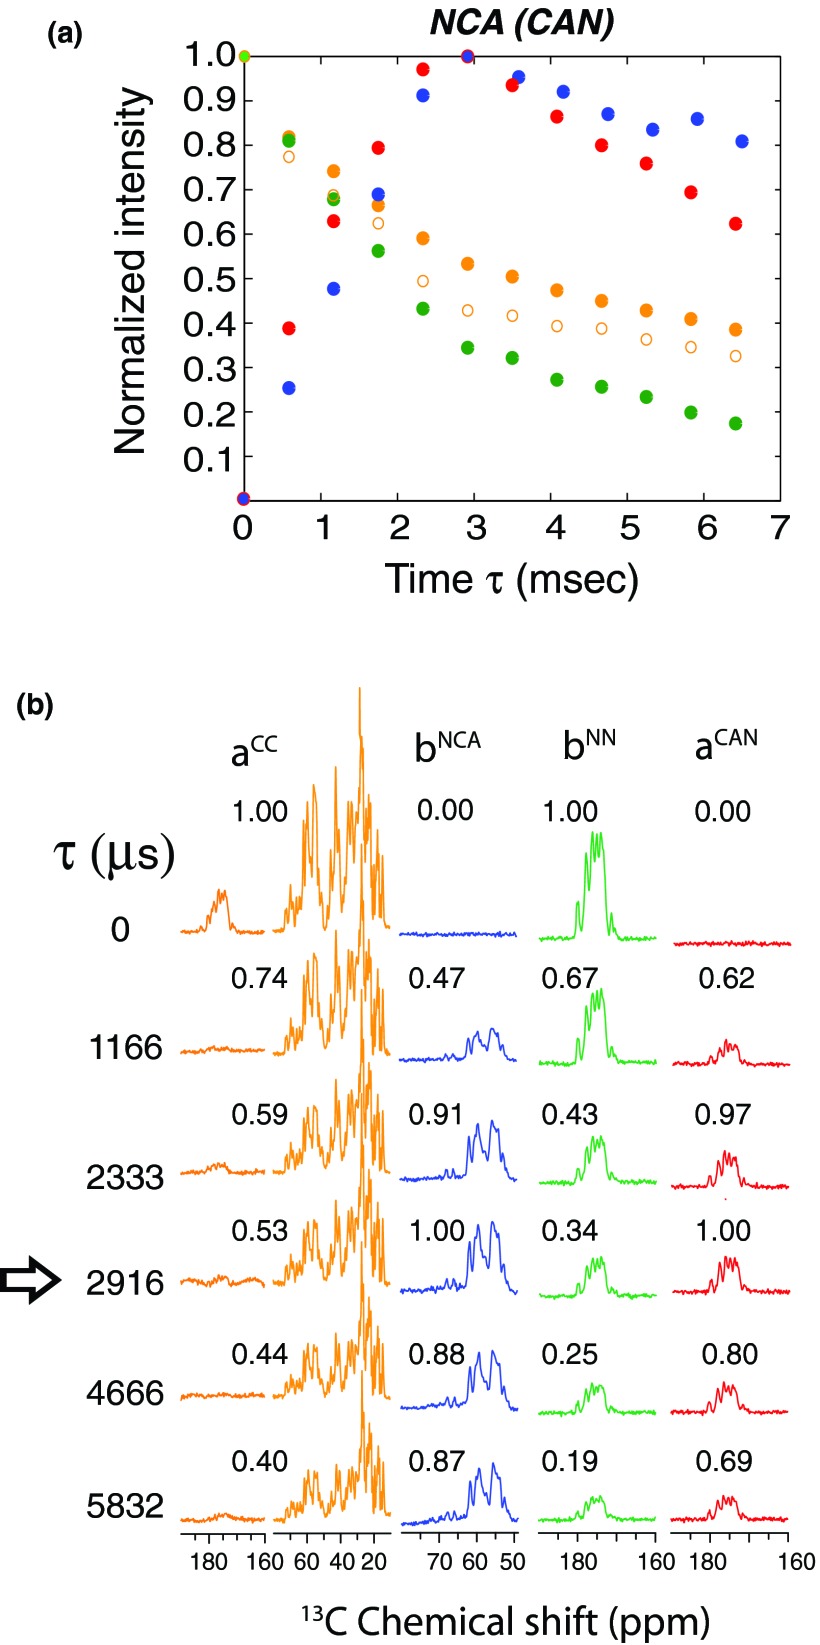
Figure 2.
(a) Experimental plot of ubiquitin showing the normalized intensities of four pathways during NCA (or CAN) transfer, as a function of specific-CP contact time (τ). Each data point is obtained by integrated intensities of the 1D spectra shown in (b), by using the pulse sequence of Fig. 1a with , , and DARR mixing period set to zero. The maximum intensity of each pathway is normalized to one. The data points (a) and the corresponding spectra in (b) are color-coded according to respective pathways shown in Fig. 1. Open and closed orange colored circles indicate Cα (50–75 ppm) and aliphatic carbon region (0–75 ppm) intensities. The arrow indicates the optimal contact time (2916 μs) for maximum NCA and CAN transfer. The residual magnetization at 2916 μs corresponds to ∼34% for 15N and ∼43% for the 13Cα (50–75 ppm) and 54% for 13C aliphatic (0–75 ppm) resonances. The residual magnetization of C′ region is less than 5% due to insufficient spin lock field.

