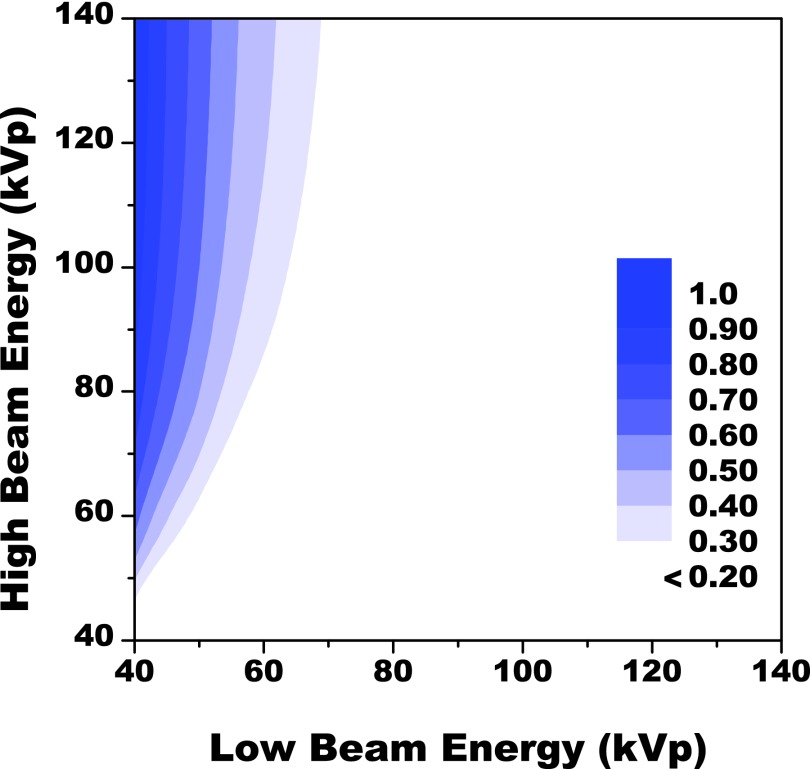
Figure 3.
A two axis contour plot showing the distribution of FOM values as a function of the low and high energy beams. The results are given in arbitrary units and normalized to the highest FOM observed in the study which was at a beam energy combination of 40 and 140 kVp. The optimal distribution of dose at this combination was approximately 50:50.

