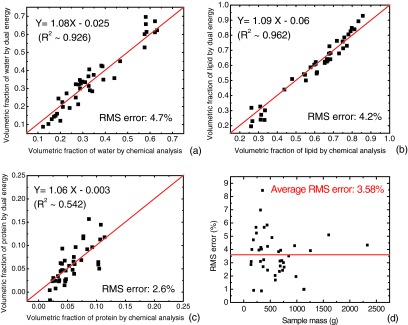
Figure 6.

Results of the tissue compositional studies for all 40 samples. The volumetric fractions of water (a), lipid (b), and protein (c) contents measured with dual kVp technique are presented as a function of the results obtained from chemical analysis. Identity lines are drawn for visual guidance. Excellent correlations with slopes very close to one can be observed for all three contents. (d) The RMS errors of three-material decomposition for all 40 samples are plotted as a function of sample mass. The average RMS error of 3.6% is noted by the straight line.
