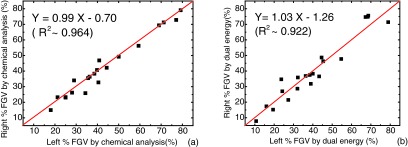
Figure 7.

Correlation of the %FGV between left and right breast samples from the same pair for chemical analysis (a) and dual kVp CT decomposition (b). In both cases, the slopes are close to one, which suggest the similarity of the tissue composition in the same pair of breasts.
