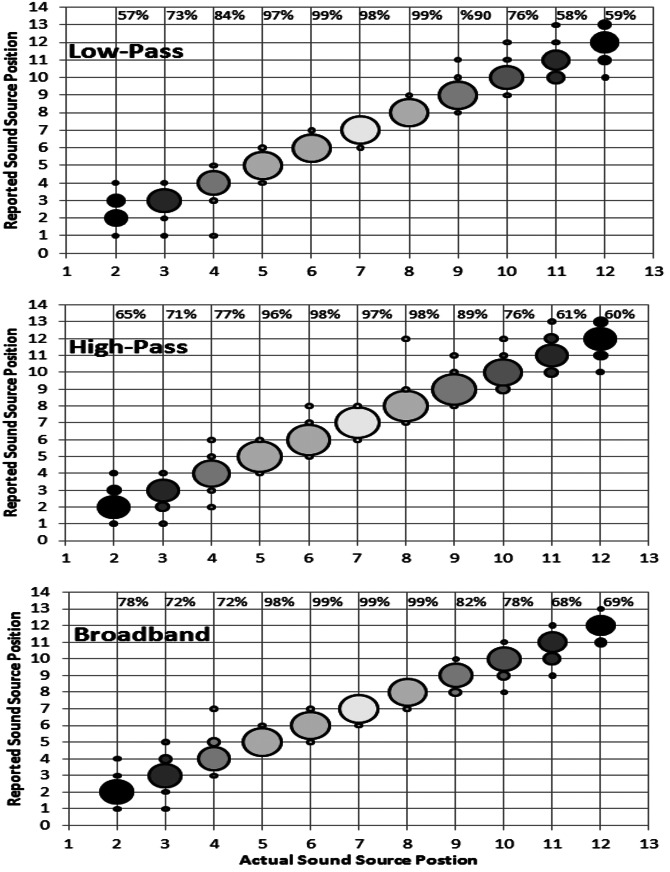
Figure 7.
Bubble plots indicating the percent of loudspeaker locations listeners reported as the sound source location vs the actual loudspeaker that presented the sound. Size of bubble proportional to percent reported (bubble sizes in 12.5% steps; smallest bubble on the plot is 0% to 12.5% and the largest bubble on the plot is 87.5% to 100%). Numbers at the top of each panel represent the percent correct localizations for the loudspeaker location indicated at the left of the percent measure. Data for the three filter conditions are shown (Top panel: Low-pass filter; Middle panel: High-pass filter; Bottom panel: Broadband filter).

