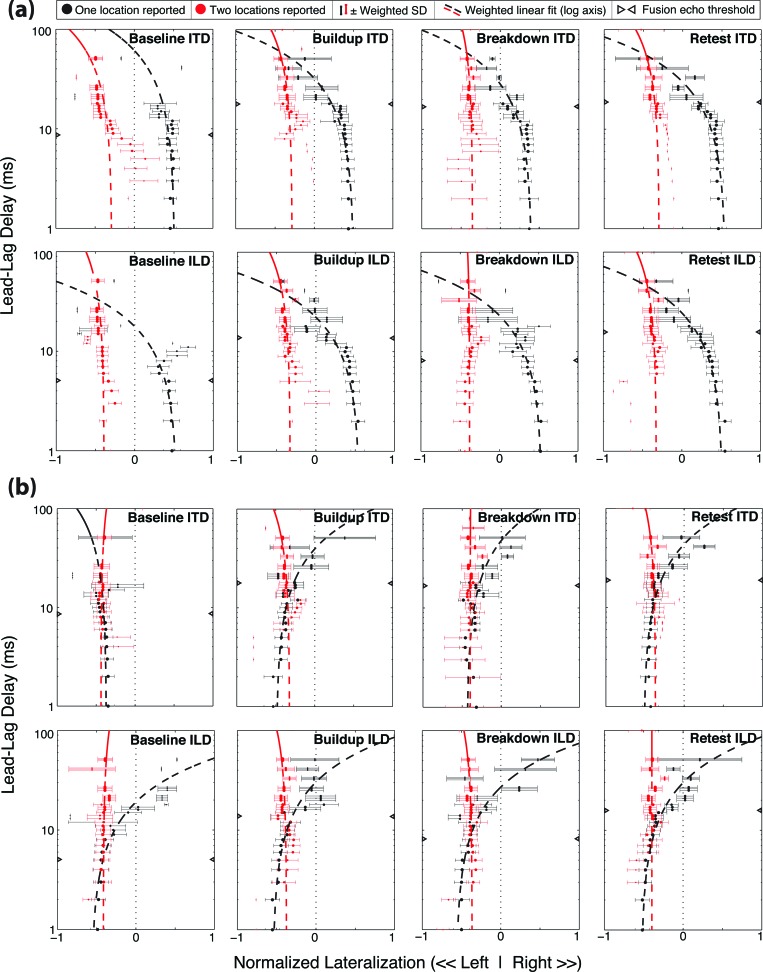
Figure 3.
Lateralization data for experiment I. (a) Mean “one location” (black) and “two locations” (red) responses for right-lead, left-lag trials. Means are weighted by the number of subjects and trials they consider; error bars give ±1 weighted SD. Dashed black and red lines give weighted linear fits to the mean data (note logarithmic lead-lag delay axis). (b) Responses for left-lead, right-lag stimuli. Note that echo thresholds (inward pointing triangles) were measured independent of lateralization and are included for comparison with lateralization data only. For further explanation of lateralization analyses, see Sec. 3A2.

