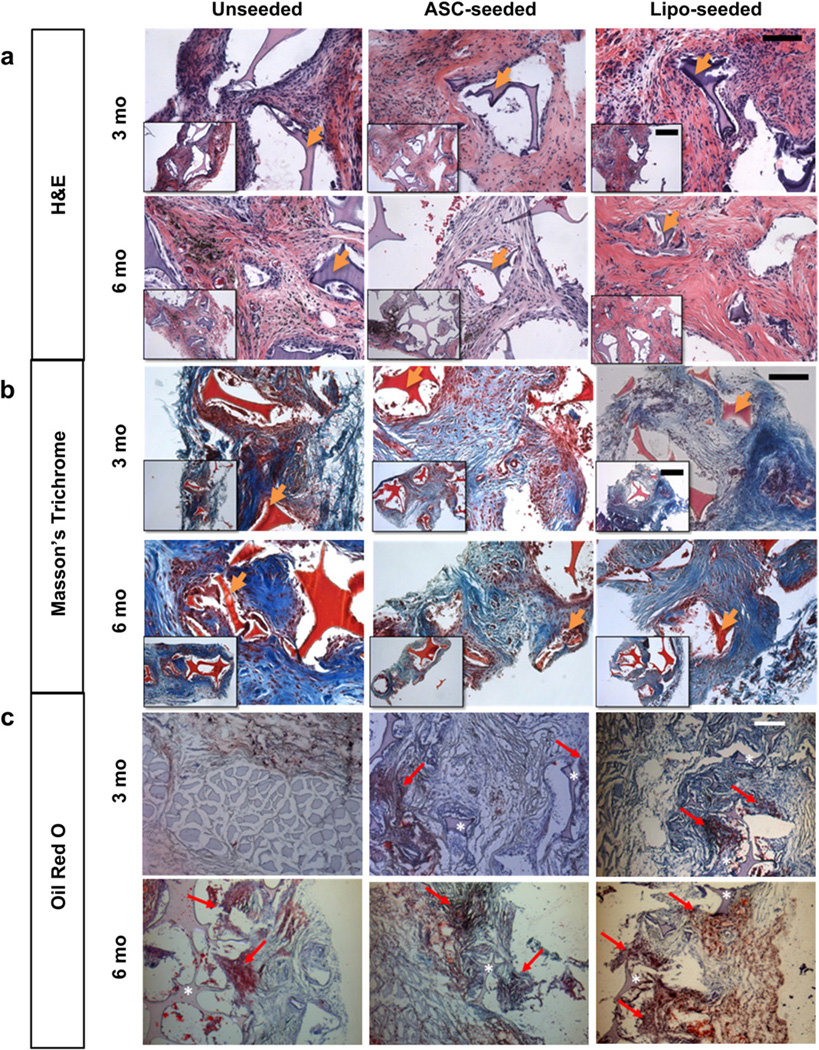
Fig. 4.
Histological tracking of regenerated tissue show an active tissue remodeling process. (a) H&E images at 3 (top) and 6 months (bottom) show a decrease in macrophages within the sponge from 3 to 6 months. Macrophages are seen surrounding the silk pore wall in the unseeded group (left) at 3 and 6 months. The intact silk sponge stains a dark purple and is visible in all groups. Hemosiderin deposits (dark or black deposits) were present is some sections as with the later timepoints (see Supplementary Fig. 2). Scale bar – 100 µm, inset – 200 µm. (b) Masson’s Trichrome staining for tissue organization at 3 (top) and 6 months (bottom). The intact silk sponge stains red and is visible in all groups. At 3 months, the unseeded study group (left) has a collagenous matrix (blue) that is poorly organized in comparison to the seeded groups. By 6 months (bottom) more matrix (blue) is seen. Scale bar – 100 µm, inset – 200 µm. (c) Oil Red O (ORO) for staining mature adipocytes at 3 (top) and 6 months (bottom). The intact silk sponge (asterisk) stains a light purple and is visible in all groups. Areas of ORO positive staining are pointed to with a red arrow. At 3 months (top), only the seeded groups (middle, right) were positive for ORO, the unseeded group (left) was positive for ORO only near the underlying muscle as shown. The lipo-seeded group (right) stained the most densely for ORO. Scale bar – 200 µm. (For interpretation of the references to color in this figure legend, the reader is referred to the web version of this article.)

