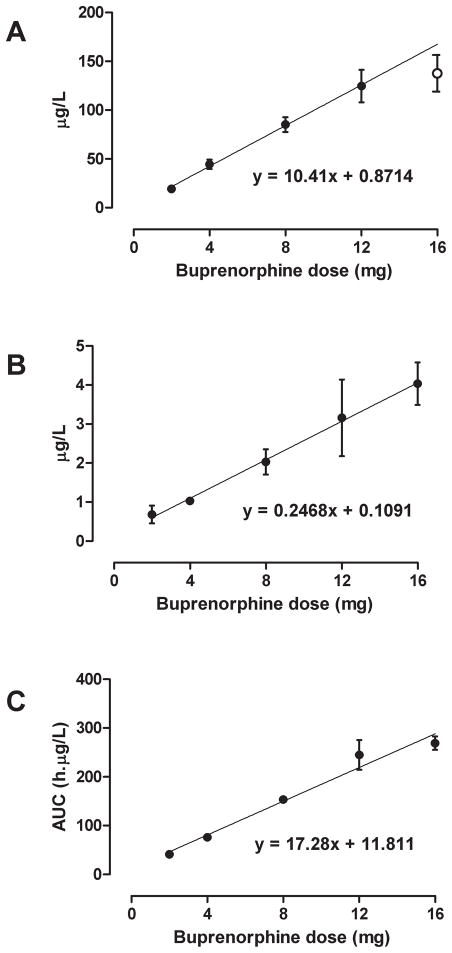
Figure 2.
Mean ± SE maximum plasma buprenorphine (A) and norbuprenorphine (B) concentrations and area under the curve of buprenorphine concentrations (C) after IV administration of 2, 4, 8, 12 and 16 mg buprenorphine to five non-dependent IV heroin users. Linear regression calculated on all 5 doses for panels B and C and on 2–12 mg (●) for panel A.

