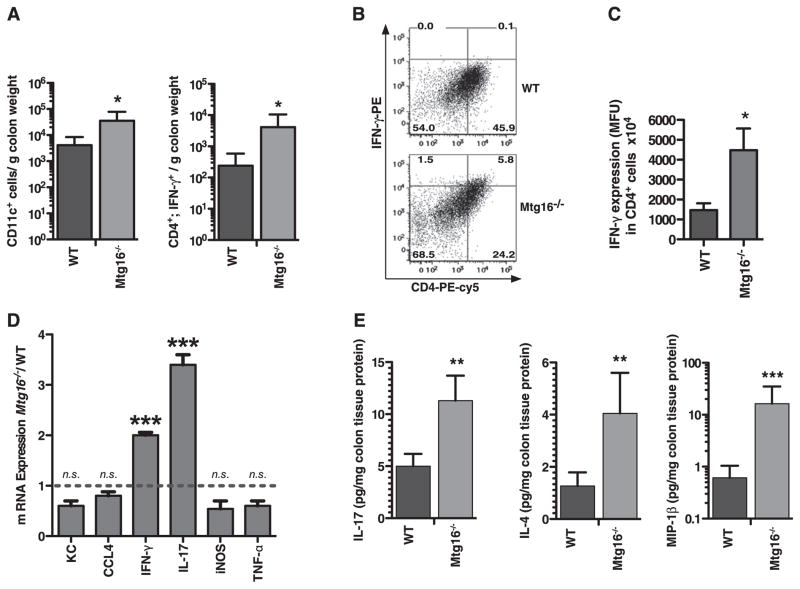
Figure 2.
Immunophenotyping of Mtg16−/− colons reveals increased innate and adaptive immunity. (A) Immunophenotyping using flow cytometry of WT or Mtg16−/− colons (WT (n=6) or Mtg16−/− (n=6) colons). (B) Representative density plots for CD4 IFN-γ-producing cells are shown (cell percentages displayed in corners). (C) Increased IFN-γ production by CD4 cells in Mtg16−/− colons. (D) mRNA expression from Mtg16−/− colons presented as fold change from WT (dashed line, SD shown, ***p<0.001). (E) Multi-analyte profiling using the Luminex platform demonstrating increased IL-17, IL-4 and MIP-1β in Mtg16−/− colons (*p<0.05, **p<0.01, ***p<0.001).

