
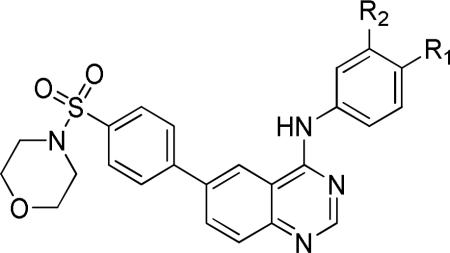
Table 3.
T. brucei growth inhibition data for headgroup variations of 10a.
| ||||
|---|---|---|---|---|
| Compd | R1 | R2 | Tbb EC50 (μM)a,b | HepG2 IC50 (uM) |
| 10a |

|
Cl | 1.39 | >15 |
| 20a | H | H | 1.44 | > 3 |
| 20b | CH3 | H | 1.15 | > 15 |
| 20c | OH | Cl | 1.06 | > 15 |
| 20d | OCH3 | Cl | 0.82 | > 15 |
| 20e |
|
Cl | 1.35 | > 15 |
| 20f |
|
Cl | 0.68 | > 15 |
| 20g |
|
Cl | 0.66 | > 15 |
| 20h |
|
Cl | 0.82 | >15 |
| 20i |
|
Cl | 1.65 | > 15 |
| 20j |
|
Cl | 1.34 | > 15 |
| 20k |
|
Cl | 1.43 | > 15 |
| 20l |
|
Cl | 0.54 | > 15 |
| 20m |
|
Cl | 1.12 | > 3 |
| 20n |
|
H | 0.65 | > 15 |
| 20o |
|
OCH3 | 1.88 | > 15 |
a
All EC50 values are ± 7%.
b
Concentration giving 50% inhibition of growth of T brucei brucei Lister 427 cells