
Table 4.
T. brucei and HepG2 growth inhibition data for focused analogs of 10a.
| |||||
|---|---|---|---|---|---|
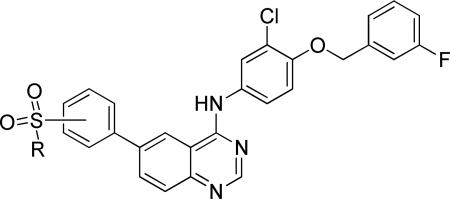
| Entry | Compd | position | R1 | Tbb EC50 (μM)a,b | HepG2 IC50 (uM) |
| 1 | 10a | p |
|
1.39 | >15 |
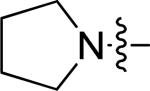
| 2 | 10k | m |
|
0.33 | > 15 |
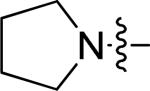
| 3 | 10l | p |

|
0.32 | > 15 |
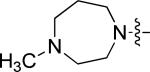
| 4 | 10m | m |
|
0.46 | >15 |
| 5 | 10n | p |
|
0.35 | > 15 |
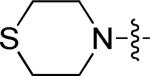
| 6 | 10o | m |
|
0.25 | > 15 |
| 7 | 10p | p |
|
0.53 | > 15 |
| 8 | 10q | p |
|
0.81 | 1.81 |
| 9 | 10r | p |
|
0.47 | > 15 |
| 10 | 10s | p |
|
0.28 | 3.32 |
| 11 | 10t | p | CH3 | 0.90 | > 15 |
| 12 | 10u | m | CH3 | 3.21 | > 15 |
| 13 | 10v | o | N(CH3)2 | 1.04 | > 15 |
| 14 | 10w | o | NHC(CH3)3 | 4.66 | ndc |
a
All EC50 values are ± 7%.
b
Concentration giving 50% inhibition of growth of T brucei brucei Lister 427 cells.
c
Not determined.