Fig. 15.

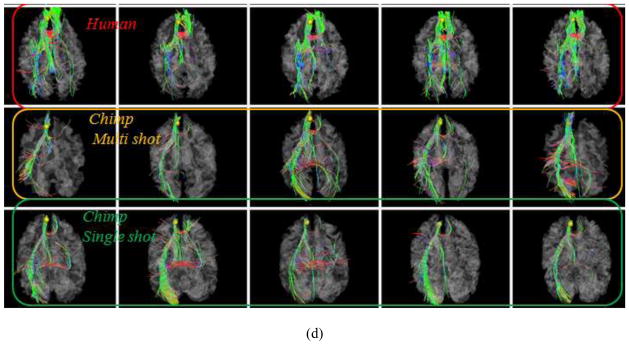
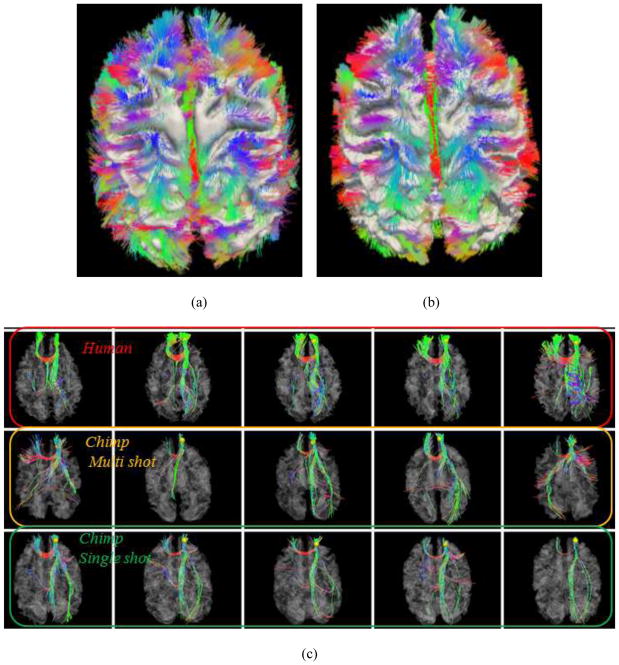
Results of DICCCOL landmark prediction in DTI data of different acquisition protocols (multi-shot vs. single-shot echo planar imaging). This figure illustrates two examples of landmark predictions by our method. The same chimpanzee subject was scanned using different DTI data acquisition protocols and parameters. (a) The joint visualization of whole-brain DTI-derived fiber tractography result and cortical surface using multi-shot DTI data. (b) The joint visualization of whole-brain DTI-derived fiber tractography result and cortical surface using single-shot DTI data. (c) Visualization of fiber bundles of the landmark in five human brains (top row), five chimpanzee brains with multi-shot DTI data (second row) and five macaque brains with single-shot DTI data (bottom row). (d) Visualization of fiber bundles of another landmark in five human brains (top row), five chimpanzee brains with multi-shot DTI data (second row) and five macaque brains with single-shot DTI data (bottom row).

