
Fig. 16.
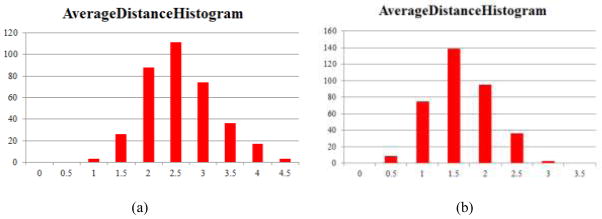
Histograms of average Euclidean distances between predicted DICCCOLs with three search ranges in chimpanzee (a) and monkey (b) brains. The horizontal axis and vertical axis represent distance (in mm) and the number of DICCCOLs, respectively.