
Fig. 2.
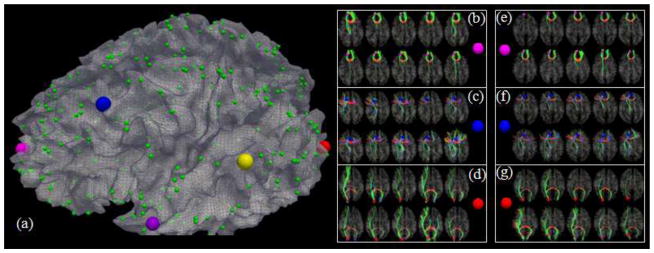
(a): The 358 DICCCOLs. (b)–(d): DTI-derived fibers emanating from 3 landmarks, represented by enlarged color bubbles in (a), in 2 groups of 5 subjects (in 2 rows) respectively. (e)–(g): The predicted 3 landmarks in 2 group of 5 subjects (in 2 rows) and their corresponding connection fibers.