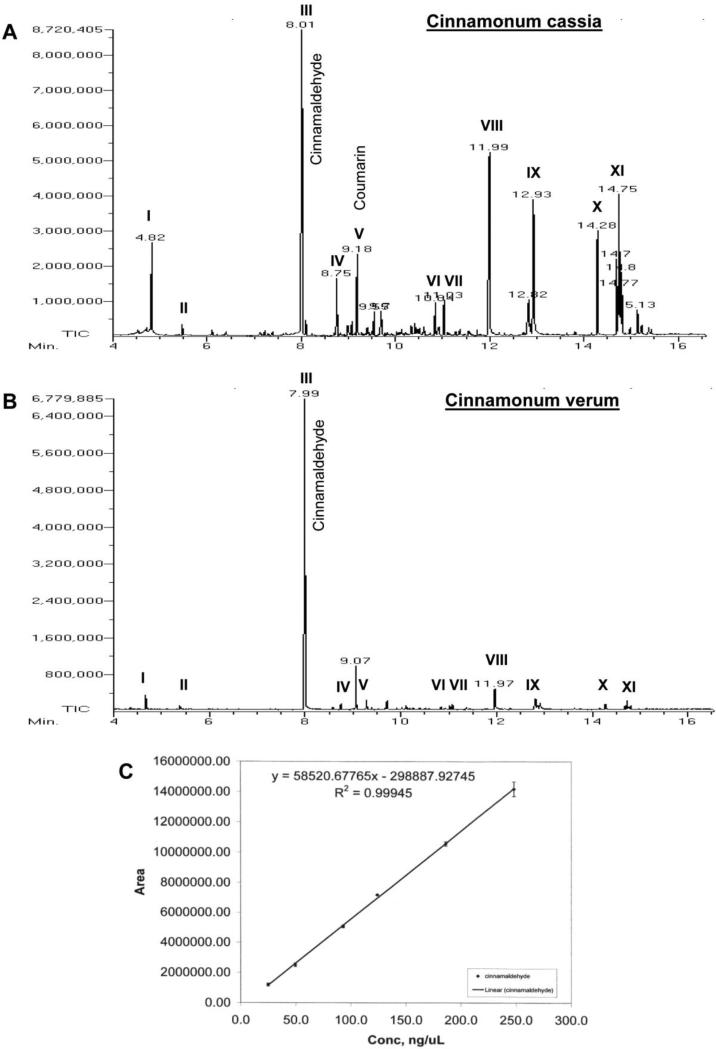
Figure 3. Mass spectrometric analysis of cinnamon extract.
One gm cinnamon powder (A, Cinnamonum cassia; B, Cinnamonum verum) was solubilized in 5 ml acetonitrile by vortexing for 5 min. After centrifugation, the extract was loaded onto a GC mass spectrometer (JEOL GCmate). Different peaks [I, styrene; II, benzaldehyde; III, cinnamaldehyde; IV, cinnamic acid; V, benzopyran-2-one or coumarin; VI, benzene, 1,1’-(2-butene-1,4-diyl)bis-; VII, benzene, 1,1’-(1,2-cyclobutanediyl)bis-, trans-; VIII, palmitic acid; IX, stearic acid; X, 4-phenylbutyl chloride; XI, (2,3-diphenylcyclopropyl)methyl phenyl sulfoxide] were identified in the University of Illinois at Chicago Research Resources Center (UIC RRC) using the NIST Mass Spectral Database Library. C) Since cinnamaldehyde was found to be the major peak, a standard curve for cinnamaldehyde was made to quantify the level of cinnamaldehyde in cinnamon extracts. Results represent three independent experiments.

