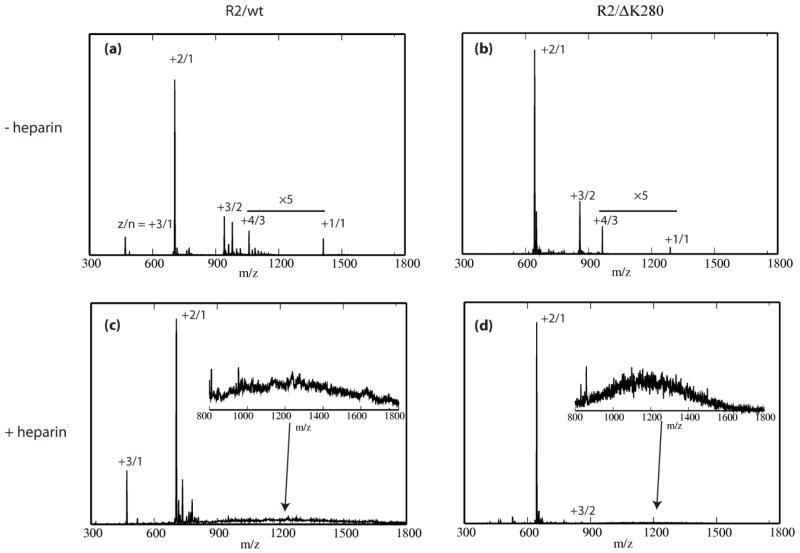
Fig 4.
ESI-q-mass spectra of R2/wt and R2/ ΔK280 in 20 mM ammonium acetate buffer. (a) The mass spectrum of R2/wt. (b) The mass spectrum of R2/ΔK280. (c) and (d) Mass spectra of R2/wt and R2/ΔK280 with heparin, respectively. Peaks corresponding to the z/n = +3/1, +2/1, +3/2, +4/3, and +1/1 are present (where z is the charge and n is the oligomer order), as indicated by the Figure.

