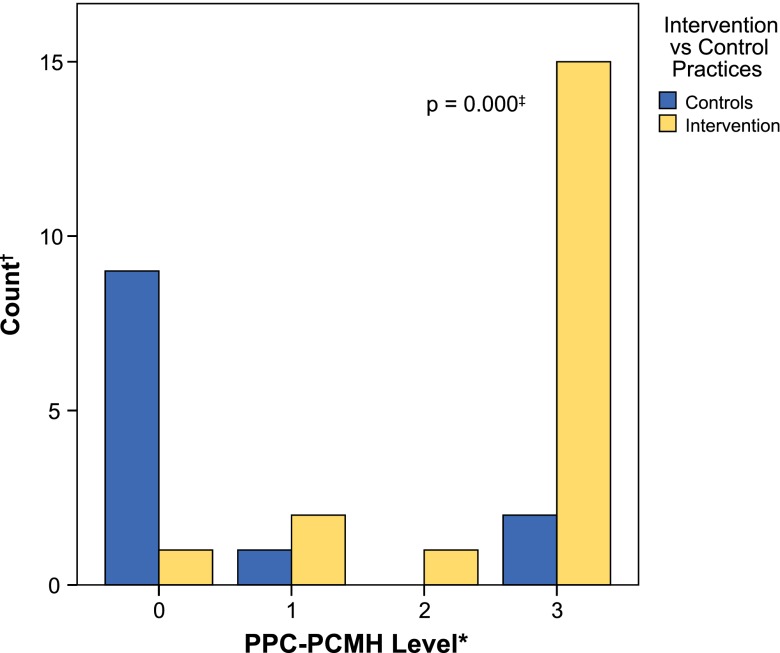
Figure 2.
Distribution of PPC®-PCMH™ levels at 18-month follow-up by study condition. * Zero values represent practices that did not achieve NCQA recognition. † Number of practices at each PPC®-PCMH™ level at 18-month follow-up. ‡ Kolmogorov–Smirnov (K–S) statistic p-value of significant differences in distributions.

