
Fig. 6.
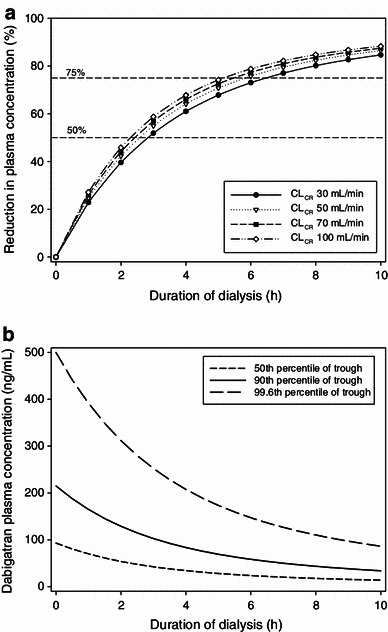
a Predicted reduction in plasma concentration (%) vs. duration of dialysis displayed for patients with different creatinine clearance values. b Predicted plasma concentrations vs. duration of dialysis for three different initial concentrations representing the observed median and the 90th and 99.6th percentiles of the trough plasma concentrations of the 150 mg dose group in the RE-LY trial. CL CR creatinine clearance