
Fig. 7.
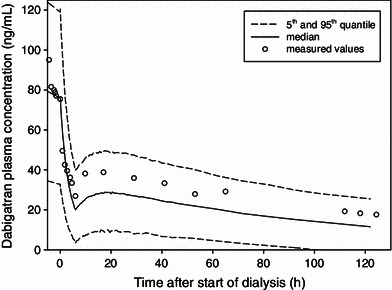
External prediction of the time profile of the plasma concentrations measured in a patient undergoing hemodialysis. Measured values are shown as open circles. Predicted median and 5th and 95th percentiles are represented as lines
Official websites use .gov
A
.gov website belongs to an official
government organization in the United States.
Secure .gov websites use HTTPS
A lock (
) or https:// means you've safely
connected to the .gov website. Share sensitive
information only on official, secure websites.
External prediction of the time profile of the plasma concentrations measured in a patient undergoing hemodialysis. Measured values are shown as open circles. Predicted median and 5th and 95th percentiles are represented as lines