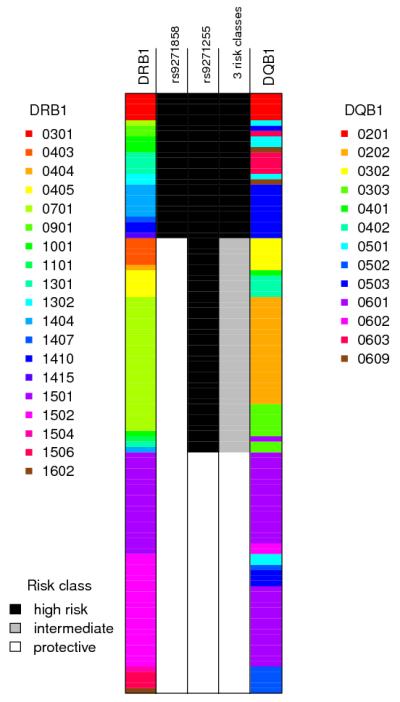
Figure 3.
Schematic representation of the HLA and SNP phased Indian discovery haplotypes in the MHC region. Each row represents an individual haplotype, the three middle columns show different risk models as described in the text, with the shading denoting which class in the model that haplotype is in: column 2 shows the classification of haplotypes based solely on the allele (risk or protective) present at the top SNP rs9271858; column 3 shows the classification of haplotypes based solely on the allele (risk or protective) present at the top SNP in the conditional analysis, rs9271255; column 4 shows the three risk groups as described in the text, which can also be defined as the allele combinations (risk-risk, protective-risk, protective-protective) at SNPs rs9271858 and rs9271255 that most parsimoniously capture their phase-known haplotype associations with disease (see text and Supplementary Figure 1). In India (N=3732), the frequencies of the 2-SNP haplotypes are A_A 0.301, A_G 0.310, G_A 0.372, G_G 0.017. In Brazil (N=1026), the frequencies of the 2-SNP haplotypes are A_A 0.406, A_G 0.097, G_A 0.390, G_G 0.105. The two flanking columns show the HLA alleles at DRB1 and DQB1 and are colour-coded as shown in the legends. The protective risk class correlates perfectly with haplotypes carrying DRB1 *15, *16 and *01. This analysis used the subset of individuals in the Indian discovery data for whom classical HLA alleles were available, and the plot above shows only the 112 haplotypes for which the posterior probability of the estimated phase at both DRB1 and DQB1 was >0.9. Note the haplotype carrying DRB1*0101 is rare and not shown in the plot as it did not occur on a haplotype with a successfully phased DQB1 allele.

