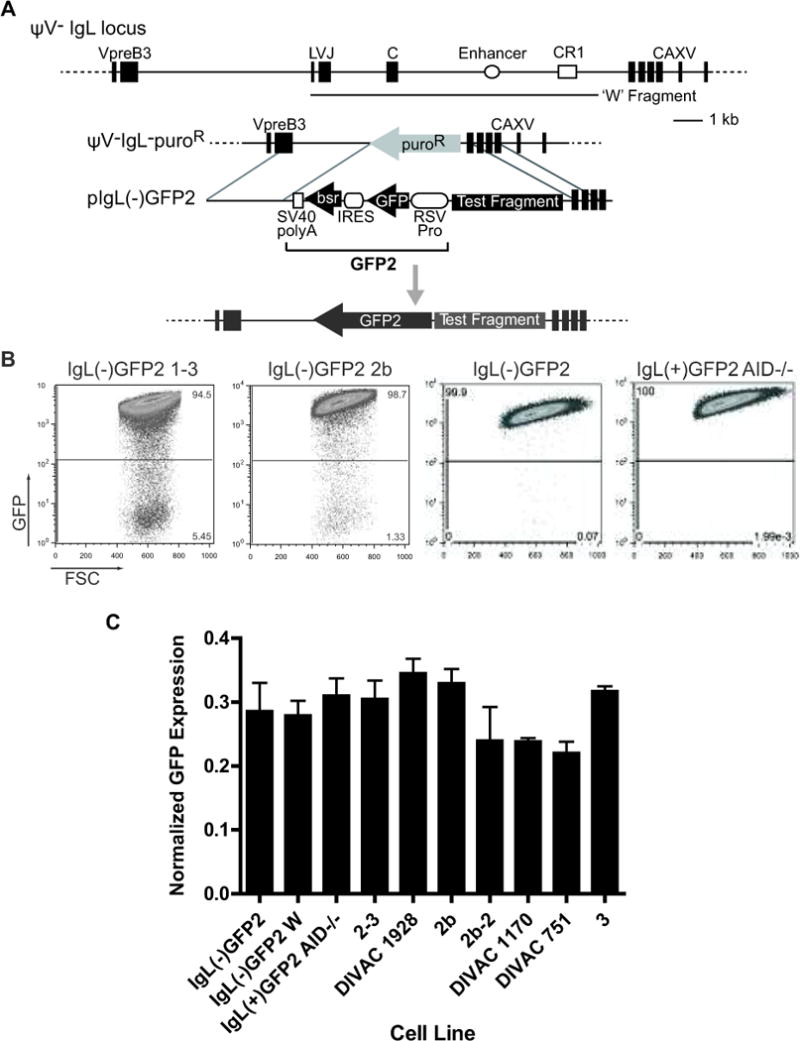
Figure 1. The DT40 DIVAC experimental system.

(A) Upper part: Schematic diagram of the ψV−IgL locus. Exons for IgL (leader (L), VJ, and constant (C)) and the surrounding genes VpreB and CAXV (carbonic anhydrase XV; predicted) are depicted as black boxes. The IgL enhancer and chicken repeat region 1(CR1) are shown as an open circle and open square, respectively. The location of the W Fragment (34) (GenBank accession no. FJ482234) is depicted with a line below the main diagram. The position and size of each of these elements are drawn to scale. Lower part: Map of the ‘empty’ IgL locus in the ψV−Ig−puroR cell line, targeting construct including the GFP2 reporter, and IgL locus after targeted insertion of the GFP2 reporter are shown. (B) FACS analysis of representative primary transfectants (21 days of culture) for the indicated targeting constructs. (C) Transcript levels of the GFP coding region assayed by Taqman quantitative RT-PCR. Bars show average signals for GFP transcripts from two independently derived RNA samples from each cell line, with standard error of the mean (SEM) indicated. Transcript levels were normalized to the 18S rRNA signal for each respective sample.
