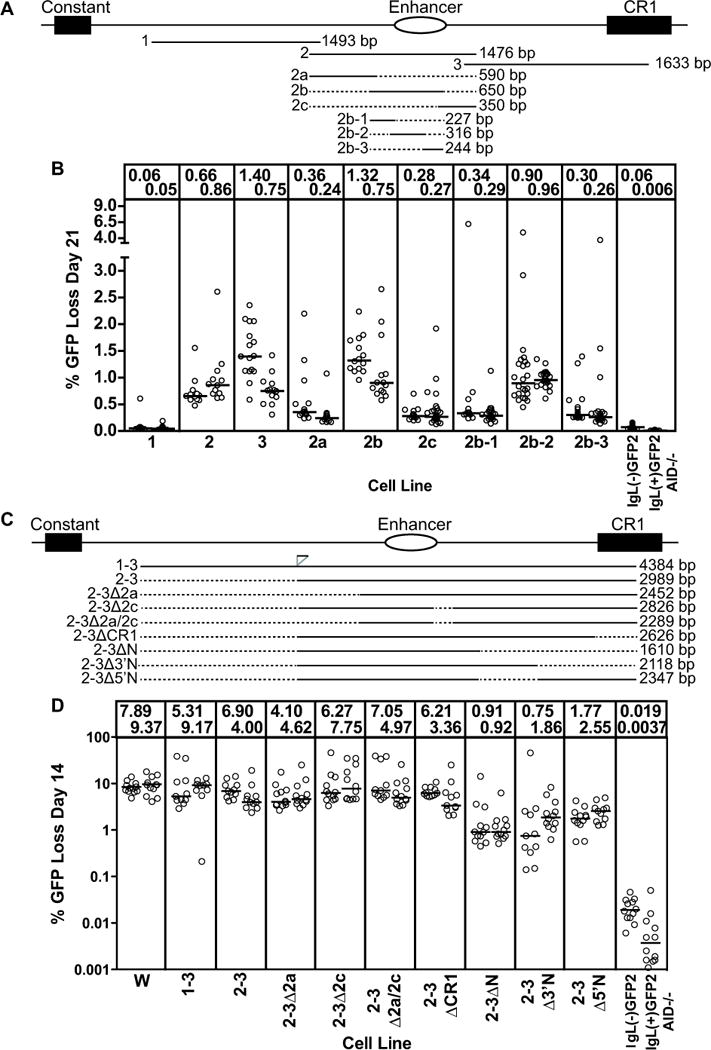
Figure 2. Localization of DIVAC activity within the W fragment.

(A,C) Schematic diagram of the region 3′ of the chicken IgL locus. The constant region exon, IgL enhancer, and CR1 element are shown. The position and length of each DNA fragment tested are specified below the locus diagram, with dotted lines indicating missing sequence. Position and size of the subfragments are drawn to scale. Note that fragment 1-3 was discovered to contain a small (approx. 100 bp) duplication of sequences from the 3′ end of fragment 1, inserted at the position indicated in panel (C). (B, D) Fluctuation analysis of GFP loss in subclones. Each circle represents percent GFP loss for one subclone and the median GFP loss value of all subclones from the same primary transfectant is indicated with a horizontal bar and stated numerically at the top of the graph. The name of the test fragment adjacent to the GFP2 cassette, from which each cell line derives its name, is indicated at the bottom of the graphs. Data in (B) and (D) derive from subclones cultured for 21 and 14 days, respectively. Note that the Y axis for (D) and all subsequent plots of % GFP loss are depicted on a log scale. In (D), the end point for the deletion in 2-3ΔN corresponds to the 5′ end of fragment "N" (34), and the deletion removes a region that increased GFP loss activity in that study.
