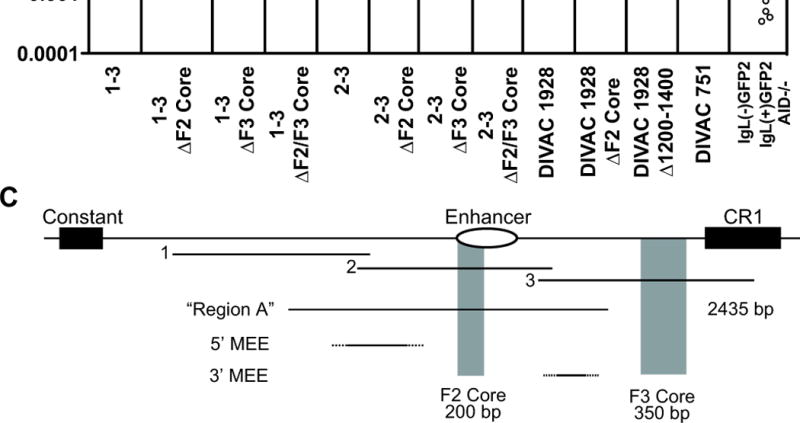
Figure 7. Analysis of F2 Core and F3 Core DIVAC elements.

(A) Schematic diagram of the position of the F2 core and F3 core regions in the region 3′ of the IgLlocus (drawn to scale). The core elements were either singly (ΔF2 Core or ΔF3 Core) or doubly (ΔF2/F3 Core) deleted from DIVAC 1-3 or DIVAC 2-3, and individually deleted from DIVAC 1928 (the equivalent of the DIVAC 1703 Δ1201-1400 deletion was performed for DIVAC 1928 in place of the ΔF3 Core deletion). Deleted DIVAC core regions are depicted with gray shading. The Δ1201-1400 equivalent deletion is shown below DIVAC 1928. The end points of DIVAC 751, which is made up primarily of the two core elements, is also shown. (B) Fluctuation analysis of GFP loss in subclones with data depicted as in Fig. 2D. The DIVAC 1-3, 2-3 and 1928 datasets are the same as those in Figure 2D, and 6B, respectively, and are shown for ease of comparison. (C) Schematic diagram of the 3′ portion of the IgL locus, drawn approximately to scale, indicating the location of fragments 1, 2, and 3, the F2 and F3 cores, region A from (35, 37) and the 5′ mutational enhancer element (5′ MEE) and 3′ MEE from (38). The 222 bp element identified as functionally important in (38) lies within the 3′MEE. Dashed lines are used to indicate that the boundaries of the MEEs have not been defined.
