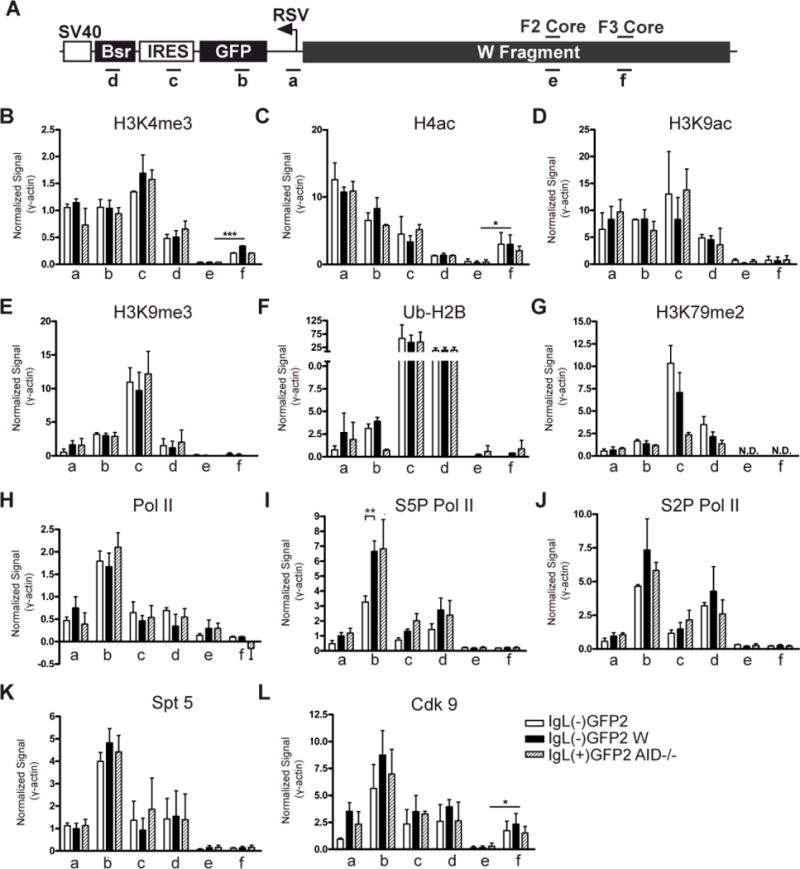
Figure 8. ChIP analysis of histone modifications and the transcription apparatus associated with GFP2.

(A) Schematic diagram of an allele containing the GFP2 expression cassette flanked by the W fragment. Regions analyzed by PCR are indicated below and the DIVAC core elements are noted above. (B-L) Levels of each modified histone or transcriptional component (denoted at the top of each graph) were assessed by ChIP in the IgL(−)GFP2, IgL(−)GFP2 W and IgL(+)GFP2 AID−/− cell lines at the regions specified. IP/Inputcorr values have been corrected for background and normalized to the input signal as described in Materials and Methods, and then were divided by the IP/Inputcorr value obtained at γ-actin in the same ChIP. Each bar indicates the mean value with SEM shown. Two-tailed unpaired t tests were used to compare the data for the IgL(−)GFP2 cell line to that from the IgL(−)GFP2 W and IgL(+)GFP2 AID−/− cell lines for each PCR region, and to compare signals for PCR regions e and f. For this latter analysis, data from the cell lines containing the W region on the rearranged IgL allele (IgL(−)GFP2 W and IgL(+)GFP2 AID−/−) were pooled for each region and then compared. Data with statistically significant differences are noted (P<0.001 (***), P<0.01 (**), P<0.05 (*)). (B) H3K4me3 (n=5); (C) H4ac (n=2); (D) H3K9ac (n=2); (E) H3K9me3 (n=2); (F) Ub-H2B (n=2); (G) H3K79me2 (n=2); (H) Pol II (n=3); (I) S5P Pol II (n=4); (J) S2P Pol II (n=3); (K) Spt 5 (n=5); (L) Cdk9 (n=3).
