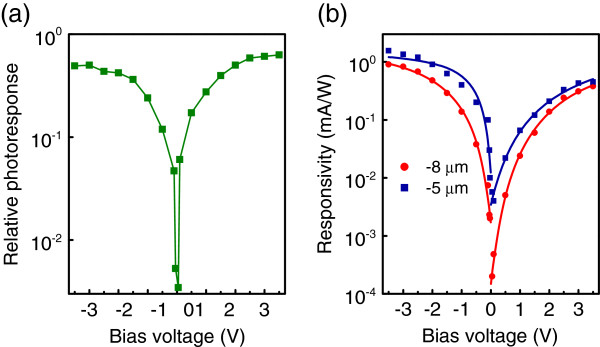
Figure 4.

Relative photoresponse and responsivity. (a) Relative photoresponse of the device in long- and mid-wave regions. (b) Responsivity at λ=5 and 8 μm as a function of applied bias. Solid curves are the best fit of experimental data to expression (1). The sample temperature is 90 K.
