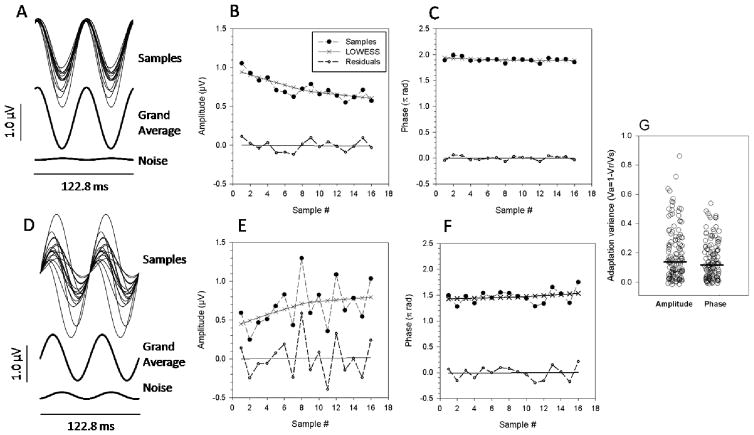
Figure 1.
Summary of adaptive PERG changes occurring during continuous presentation over 4 minutes of a pattern stimulus reversing in contrast 16.28 times/s. A, D:Representative examples of sequential PERG samples. SuperimposedPERG waveforms are the time-domain representations of the 16.28 HzPERG component evaluated by DFTanalysisofsuccessive samples of 50 epochs each(~ 15 s). Panels A, D also show the grand-average waveform of all samples recorded during pattern presentation, as well as a noise waveform obtained by averaging 4 samples during presentation of a uniform grey field. Panels B, C, E, F show how the amplitude and phase of successive samples (filled symbols) change over time together with corresponding LOWESS regression functions (continuous lines with x symbols), from which the initial and final amplitude or phase were calculated. Panels B, C, E, F also show the amplitude and phase of residuals (open symbols)and corresponding regression functions(continuous lines). Note that the magnitude and sign of adaptive changes, as well as the residual variability of PERG amplitude, is different in the two subjects. Also note that the residuals do not show any trend. G: Proportion of variance due to adaptive changes of the PERG signal relative to the total variance for all eyes of subjects. Variance due to adaptation(Va) was calculated as 1 minus the ratio between the variance of residuals (Vr) and the variance of samples (Vs). The horizontal thick lines represent the median Va for amplitude and phase.

