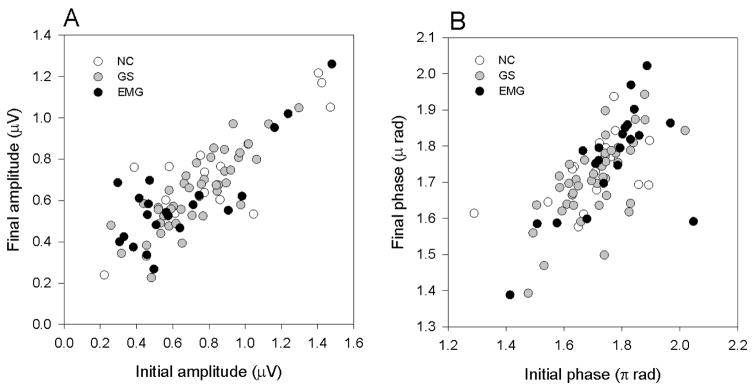
Figure 3.

Relationship between initial and final amplitude(A) and initial and final phase (B)of the steady-state PERG in response to high contrast, pattern reversal stimuli presented over 4 minutes. Different symbols refer to different subjects groups (NC, normal controls, n=16; GS, glaucoma suspects, n=42; EMG, early manifest glaucoma, n=22). For all subjects, amplitudes/phases of the two eyes were averaged.
