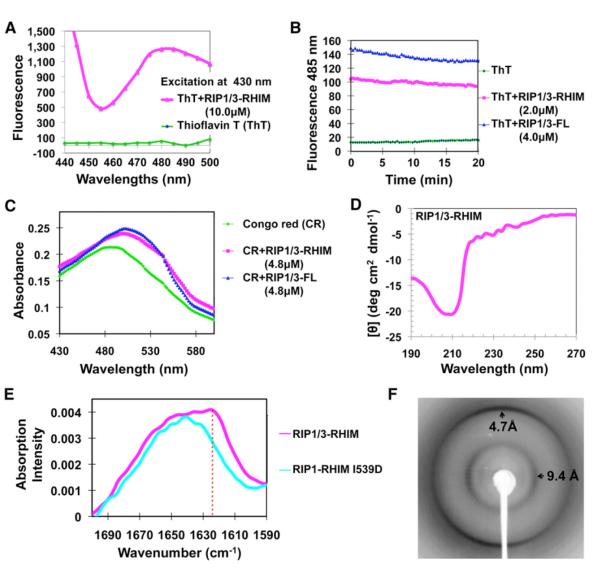
Figure 2. The RIP1/RIP3 Complex Is Amyloidal.
(A) Fluorescence emission spectra of ThT in the absence (green) and presence (magenta) of the RIP1/RIP3-RHIM complex.
(B) Both the RIP1/RIP3-RHIM and the full-length RIP1/RIP3 complex bind ThT.
(C) Absorption spectra of CR in the absence (green) and presence of either RIP1/RIP3-RHIM (magenta) or full-length RIP1/RIP3 complex (blue).
(D) Circular dichroism spectrum of the RIP1/RIP3-RHIM complex.
(E) Superimposed Fourier transform infrared spectra of RIP/RIP3-RHIM (magenta) and the I539D mutant of RIP1 (cyan). Only the WT RIP1/RIP3 complexes, not the RHIM mutant, showed the amide I’ maxima at 1,623 cm−1 (dashed vertical red line), which is characteristic of β-amyloid.
(F) An X-ray diffraction image of partially aligned RIP1/RIP3 fibrils. The arrows indicate equatorial and meridional reflections at 9.4 Å and 4.7 Å resolutions, respectively.
See also Figure S2.

