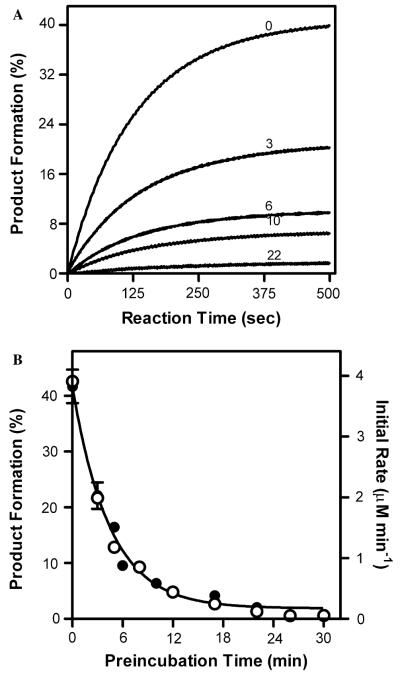
Fig. 1.
Loss of BMR activity toward cyt c as a function of time in minutes. (A) Time course for cyt c reduction by BMR whereby conditions were 0.3 nM BMR, 20 μM cyt c, and 50 μM NADPH at 30 °C. All reactions were initiated upon addition of NADPH. Numbers indicate the time of incubation of BMR under reaction conditions prior to reaction initiation. (B) Plot of initial rate, 엯, and total amount of product formed, ●, as a function of pre-incubation time. Data were fit to a single exponential decay function.

