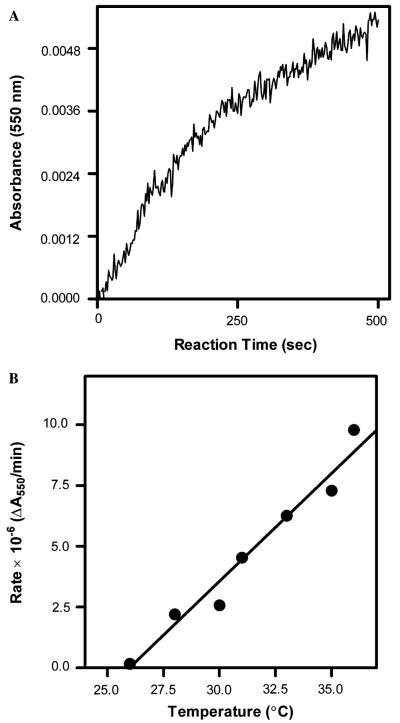
Fig. 5.
Residual activity following BMR inactivation of activity toward cyt c. (A) Sample time course for cyt c reduction (0.3 nM BMR, 20 μM cyt c, and 50 μM NADPH at 36 °C) indicating a linear rate of product formation follows an initial burst product. All reactions were initiated upon addition of NADPH. (B) Plot of the observed residual rate as a function of temperature fit to a linear regression.

