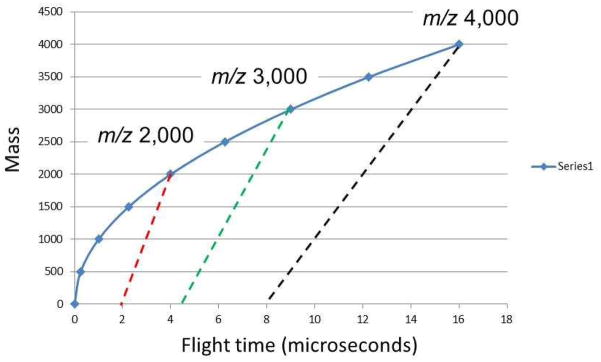
Figure 6.

Mass/charge vs. flight time scan lines for MS and MS/MS spectra on a single-stage reflectron mass spectrometer. The blue line illustrates the quadratic time dependence of the molecular ion mass, while the red, green and back dashed lines represent the linear dependence of fragment ions resulting from the decay of m/z 2,000, m/z 3,000 and m/z 4,000, respectively.
